DigitalTrains™ offers an extensive suite of analysis tools that enable users to examine and report on train performance in various scenarios. By providing graphical, tabulated, and 3D animated results, users can gain valuable insights into train behaviour and safety, ultimately informing better design decisions.
GRAPHICAL ANALYSIS
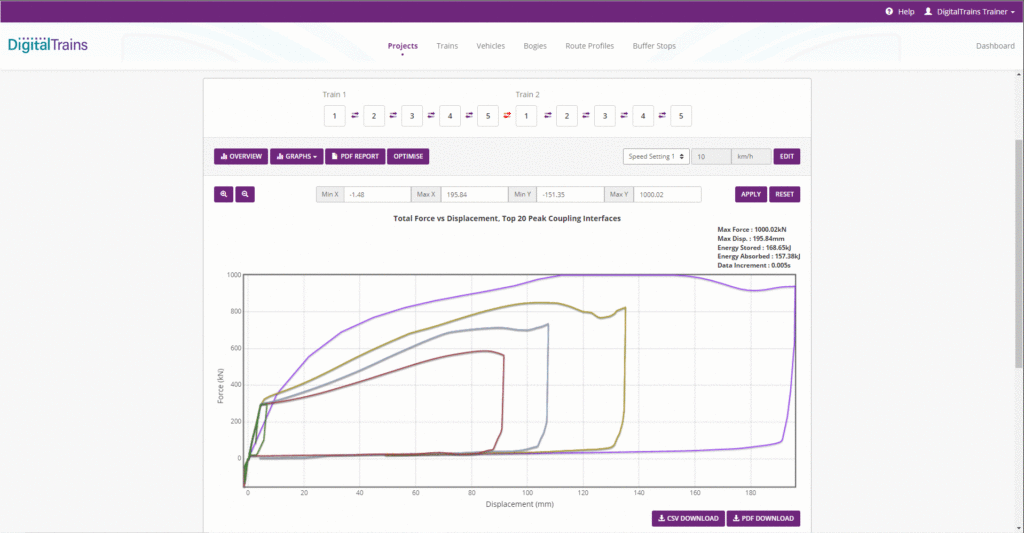
Users can view results graphically, including:
- Force-deflection of individual devices
- Force-time of individual devices
- Forces acting on each of the vehicles
- Vehicle displacement, velocity, and accelerations
Standard graphical outputs show each vehicle’s deformation against time, illustrating the sequence of events. Users can also define additional graphical outputs using virtual transducers. Graphs can be downloaded as PDF or CSV data files for further analysis.
TABULATED RESULTS
DigitalTrains™ provides tabulated results, such as:
- Maximum force or accelerations
- Damage summary
PDF Report
A comprehensive PDF report can be downloaded, containing all graphs, train details, and interface information for a thorough understanding of train performance.
3D VISUALISATIONS
Users can interact with a full 3D animation to visualize the significance of the results, enhancing comprehension. This tool allows users to interrogate the performance of individual components and gain valuable insights into train behaviour.